
Last reviewed: October 7, 2025
You bought Microsoft 365 for the organization. Weeks later, a big share of seats sit unused while license bills keep posting. That leak is a measurable cost—here’s how to quantify it and what to do about it.
TL;DR Calculate stalled-adoption cost as three parts: wasted license spend, productivity leakage from underused features, and change-management overhead. Use this simple model: (licensed seats × price) × inactive rate + (hours lost × hourly cost × impacted users) + onboarding inefficiency. Plug in your numbers below, validate assumptions, then run a targeted adoption campaign delivered inside Teams to recover value quickly.
Why this matters now
Mid-market and enterprise buyers often focus on license count and feature lists. They forget adoption. The result is two invisible drains: money paid for idle licenses and the unrealized productivity those licenses were meant to unlock. For a 200-seat M365 deployment, even a 15 percent inactive segment can total tens of thousands per year in wasted license fees alone.
Adoption risk hits three places: pipeline velocity for revenue teams who need Outlook, Teams, and Planner; operational velocity for HR and L&D; and security posture when people avoid certified workflows. Those are precisely the levers RevOps and IT leaders are measured on.
Here is a short story. A 300-person SaaS firm bought Copilot seats and E3 licenses. Only core admins used Copilot in month one. The vendor helped them run a targeted in-flow campaign, and Copilot monthly active users rose quickly. That shift turned license cost from a line item into measurable weekly time savings their CFO could track.
Our point of view
Our POV is simple. Licensing is only the start. Training without ongoing, targeted communications rarely changes behavior. Adoption succeeds when you combine communications, micro-lessons, and analytics delivered where people work. That is why measuring depth of use matters more than raw logins.
Trade-offs matter. Heavy one-day training can check a box but does not change daily habits. Continuous, role-based micro-lessons take longer to set up but scale faster and produce durable change. For many mid-market buyers, a short pilot that ties to real workflows is the lowest-risk path to prove ROI.
Our practical advice: treat the first 90 days as an adoption sprint. Use segmented messages to get managers and power users practicing new features. Track completions and feature-level use so you can tie dollar impact back to seat recovery and productivity gains.
Framework: a simple calculator you can run in a spreadsheet
Start with three lines in a sheet: License waste, Productivity leakage, Change/enablement cost. Add a final line for Recoverable savings after an adoption program.
Formula overview (each line explained):
- License waste = Licensed seats × Annual license price × Inactive rate
- Productivity leakage = Impacted users × Weekly hours lost × Hourly cost × 52
- Change overhead = One-time program cost (tools, content, admin) + ongoing comms cost
- Recoverable value = (License waste + Productivity leakage) × Expected adoption lift − Change overhead
Example (assumptions labeled):
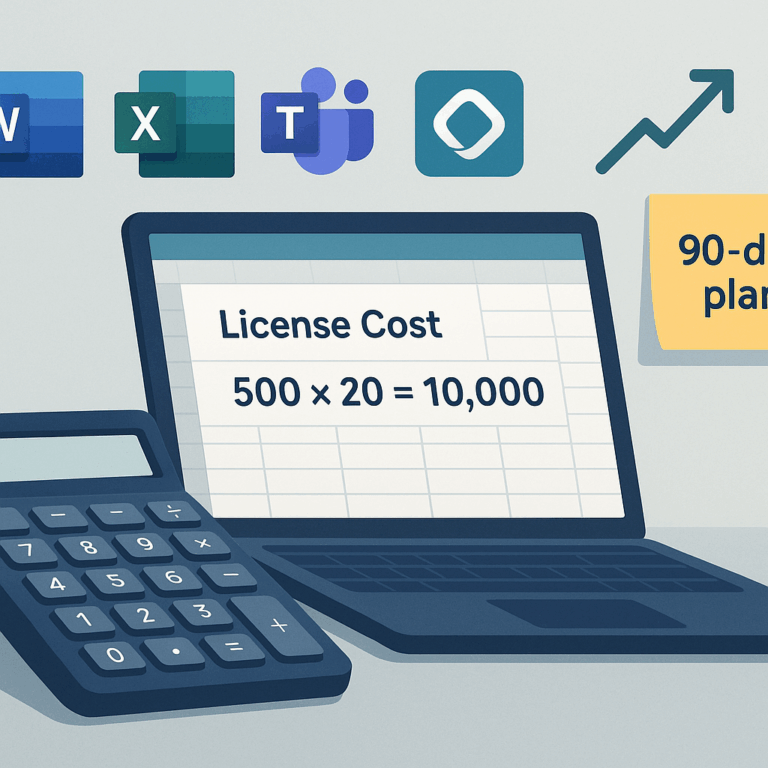
- Seats: 200
- License: Microsoft 365 E3 at $20.75/user/month (annual billing). Source: Compare Office 365 Enterprise Plans and Pricing.
- Inactive rate: 20 percent
- Impacted users for productivity loss: 40 (power users and managers)
- Weekly hours lost: 1.5
- Hourly cost: $54.39 (mean hourly for computer and mathematical occupations, BLS). Source: Bureau of Labor Statistics.
- Program cost: $25,000 first year
- Expected adoption lift: 50 percent (after targeted campaigns and micro-lessons)
Apply the math:
- License waste = 200 × ($20.75 × 12) × 0.20 = $10,560/year
- Productivity leakage = 40 × 1.5 × $54.39 × 52 ≈ $170,674/year
- Change overhead = $25,000
- Recoverable value if lift = 50%: (10,560 + 170,674) × 0.5 − 25,000 ≈ $68,617
Assumes a mid-market tech org and U.S. labor costs. Your numbers will vary. The important bit is the relative scale: productivity leakage often dwarfs license waste. That means investing in adoption campaigns pays back quickly if you can move feature use.
Diagram description: Picture three stacked blocks: Licenses at top, Productivity loss in the middle, Change cost at the bottom. The widest block usually is productivity loss. Fix that block first.
Applying this to your personas
For the VP of Revenue Operations: run the calculator with your active-seat count for Sales and SDRs. Focus adoption on Outlook, Teams, and Copilot workflows that reduce research time. Track time-to-MQL and response times to show pipeline velocity gains.
For Head of Demand Gen: segment users by campaign owners and marketers. Target micro-lessons for Teams and Planner so campaign handoffs shrink. Tie adoption completion to campaign ROI improvements.
For CRM Admins and Solutions Architects: use the model to justify integration and automation work. Show how better feature adoption reduces manual enrichment and cut ticket volume. Capture baseline metrics in the first 30 days so you can report a before/after.
Objections and common pitfalls
“We already trained users” is common. Training alone rarely creates habit. You need repeated, contextual prompts and practice tasks inside the flow of work. That is why delivery via Teams and Viva is more effective than an LMS email link.
Another pushback: “We cannot measure depth of use.” You can. Instrument feature-level events, track micro-lesson completions, and map cohorts to outcomes. That instrumentation is the difference between anecdote and evidence.
Finally, beware of one-size-fits-all content. Role-based sequences converging on specific Copilot scenarios perform better than generic tutorials. Our POV: Microsoft-first, role-based content drives measurable change faster.
How BrainStorm helps
This is exactly what BrainStorm automates—segment the audience, schedule the messages, deliver the micro-lessons, and track adoption by feature. BrainStorm pairs communications, bite-sized learning, and analytics so M365 and Copilot investments become daily habits. See BrainStorm and explore prebuilt Copilot packs to accelerate the first 90 days. For Teams and Viva delivery details, see the integration page: Meet the BrainStorm and Viva Learning integration.
FAQ
Q: How do I measure “inactive” for a seat?
A: Define inactive as no meaningful feature usage for 30 days. Examples of meaningful usage are drafting with Copilot, sharing files, or completing role micro-lessons. Tie the definition to the outcomes you care about.
Q: What adoption lift should I plan for?
A: Conservative planning uses 25 to 50 percent lift after a focused 90-day program. Use a pilot cohort to validate assumptions before scaling.
Q: Can adoption reduce license count?
A: Yes. If you can consolidate needs or move users from higher-tier seats to lower-tier seats because features are being used correctly, you can reclaim spend. Always model this conservatively and validate with usage data.
Sources
Compare Office 365 Enterprise Plans and Pricing
Bureau of Labor Statistics: Computer and Mathematical Occupations
Help users take flight with Microsoft 365 Copilot
BrainStorm on Microsoft AppSource
Meta description: Calculator and workbook to quantify wasted M365 spend and productivity loss from stalled adoption, plus a recovery playbook and BrainStorm tie-in.
Suggested URL slug: calculator-total-cost-stalled-software-adoption-m365