
Last reviewed: October 7, 2025
Too many dashboards show logins and vanity metrics while the true ROI of software waits hidden in feature use, cohorts, and time-to-proficiency. This post gives adoption leaders a compact, practical KPI set you can wire into any dashboard today—and a sample layout your execs will actually read.
TL;DR — If you run adoption for a mid-market or enterprise software program, track these 12 KPIs: activation, time-to-proficiency, depth of use, feature adoption, DAU/MAU, time-to-first-value, task completion, retention, license utilization, cohort adoption, support volume, and attestations/compliance. Measure both breadth (who used it) and depth (what they did), tie cohorts to outcomes, and prioritize license/utilization and time-to-value when you need CFO buy-in. Our POV: swap raw logins for feature-level, cohort-driven signals and pair them with targeted communications and micro-lessons delivered where people work.
Why this matters now
Budgets are tighter and application stacks keep expanding. Studies show many organizations are underutilizing provisioned software—leaving millions on the table—so adoption measurement is now a finance and security problem as much as a training one. Zylo’s 2024 SaaS Management Index found a large share of licenses go unused, which makes adoption metrics directly tied to recoverable spend.
For software adoption leaders, that means dashboards must answer two questions: who is using the product meaningfully, and how quickly are they getting to value. Measuring depth of use—feature-level and task completion metrics—lets you see if training and comms are moving behaviors, not just sessions. See Microsoft’s guidance on measuring feature and platform-level adoption for Teams as a model for feature-level telemetry. Measure App Performance – Teams.
Mini-story: a mid-market IT org we worked with had healthy DAU numbers but low task completion for collaboration templates. Once they added targeted micro-lessons in Teams, task completion rose and license churn risk dropped—because people could finish the work they needed without switching tools.
Our point of view
Adoption measurement must be outcome-led. Track the metrics that map to business outcomes (license optimization, productivity, reduced tickets) and instrument those first. Our POV: focus on three guardrails—actionability, cohort signal, and financial linkage.
Actionability: if a metric won’t change what you do next week, deprioritize it. Cohort signal: segment by role, team, or channel so you can target comms and micro-lessons. Financial linkage: show CFO how license utilization and time-to-value affect spend recovery.
Trade-offs: instrumenting feature-level telemetry takes effort and sometimes product changes. If engineering capacity is scarce, start with event-level proxies (e.g., “create file with template X” instead of a bespoke signal) and iterate. Our POV is to prioritize the metrics that unlock immediate decisions—reassigning licenses, running a targeted campaign, or launching a how-to push in Teams.
A practical framework: the 12 KPIs that matter
Use this checklist to populate a single-pane adoption dashboard. Each metric should be filterable by cohort (role, team, location) and time range (7/30/90 days).
| Metric | What to measure |
|---|---|
| 1. Activation Rate | Percent of users who complete the defined first-use action within 7 days (install -> first task). |
| 2. Time to Proficiency | Median days to complete a proficiency checklist or pass a role-based attestation. |
| 3. Depth of Use | Average number of features used or advanced actions per active user (sessions × feature count). |
| 4. Feature Adoption Rate | % of active users using a specific feature in the period (feature MAU / product MAU). |
| 5. DAU / MAU (stickiness) | Ratio that shows recurring engagement; include both product and feature-level DAU/MAU. |
| 6. Time to First Value (TTFV) | Median time from provision to completing the first high-value task. |
| 7. Task Completion Rate | % of attempted workflows finished successfully (key for templates and automation). |
| 8. Retention by Cohort | Retention curve for cohorts (7/30/90/180 day retention) by role or campaign. |
| 9. License Utilization | % of provisioned seats actively used (and unused license count for reclamation). |
| 10. Adoption by Cohort | Comparative adoption rates by persona, team, or department (helps target comms). |
| 11. Support Ticket Volume & Time-to-Resolution | Tickets per 1,000 users for new features and the median resolution time (shows friction). |
| 12. Attestations / Compliance Completion | % completion of required attestations or policy training (critical for AI/GRC programs). |
Short checklist for instrumentation: event taxonomy, mapping to business outcome, cohort keys (role/team), and a low-latency ETL to your BI layer. If you use Microsoft surfaces, instrument events for Teams and Viva actions to measure in-flow learning as recommended by Microsoft. Microsoft guidance on feature-level measurement.
How to apply this to your personas and ICPs
VPs of Revenue Operations need pipeline signals and time-to-value. For them surface license utilization, time-to-proficiency, and time-to-first-value alongside CRM conversion changes. If your SDRs are slow to convert, correlate cohort activation to MQL-to-SQL velocity and show the before/after.
Demand Gen leaders want engagement and personalization lift. Track depth-of-use and feature adoption for campaign-specific features (templates, personalization tools) and pair cohort experiments with targeted in-flow micro-lessons to lift reply/conversion rates.
CRM admins and solutions architects care about data hygiene and integration. Prioritize license utilization, event taxonomy quality, and support ticket volume. Their decision levers are integration effort and security—so provide clear metrics on reclamation opportunity and role-based attestation completion.
Enterprise IT and L&D leaders focus on long sales cycles and compliance. Use Adoption-by-Cohort and Attestations to prove policy uptake and reduce GRC risk. For Copilot or AI rollouts, pair attestations with micro-lessons to reduce exposure while ramping usage (our AI Security pack ties these signals together).
Objections and common pitfalls
“We can just use logins.” Logins are necessary but insufficient. They don’t show whether people completed high-value tasks or adopted the right features. Our POV: stop with single metrics and adopt a small set that cover activation, depth, and outcomes.
“Instrumentation is too heavy.” Start with event proxies for key workflows and iterate. You can often map existing telemetry (e.g., template-save, file-share) to task completion without product changes. Assume a phased rollout: core events first, feature-level events next.
“Data quality and privacy.” Segment data collection by role and respect privacy rules. For compliance/attestations, measure completion and store minimal telemetry required for verification. When security is a concern, surfacing only aggregate cohort results can satisfy both privacy and business needs.
How BrainStorm helps
Outcome: show measurable behavior change by feature, cohort, and license so your M365 and Copilot investments become daily habits. How we do it: automated segmented campaigns, role-based micro-lessons in Teams/Viva, and built-in adoption reporting. BrainStorm | Software Adoption Made Easy. See the Viva Learning integration and in-flow delivery details at Meet the BrainStorm and Viva Learning integration. CTA: See your M365/Copilot adoption in a live dashboard—book a 20-minute demo.
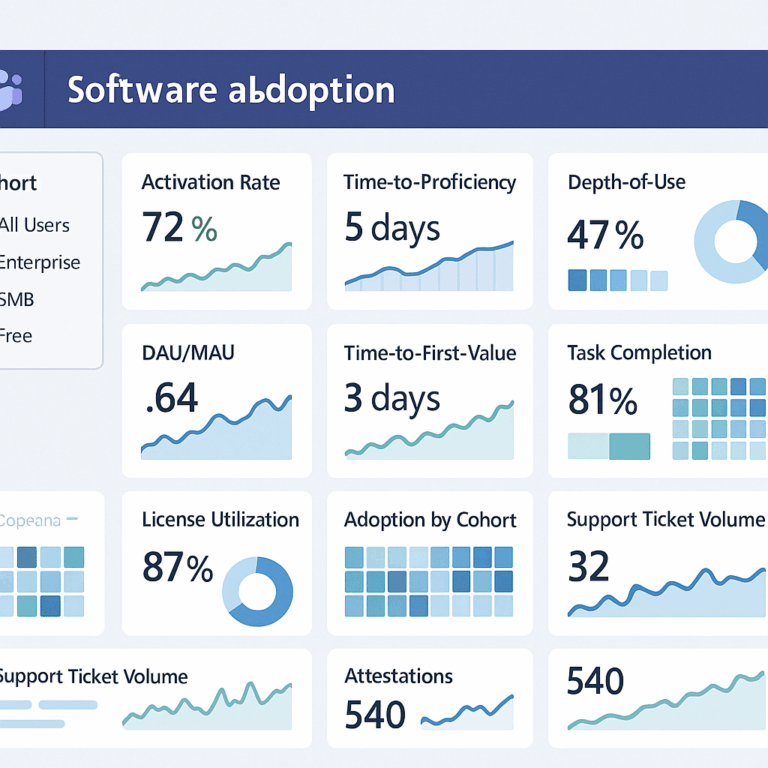
Compact dashboard layout (suggested)
Top row: license utilization, activation rate (7d), and time-to-first-value. Middle row: depth-of-use heatmap (features × cohorts), feature adoption sparkline. Bottom row: tickets by feature, attestations completion, and cohort retention curves. Include an alerts rail for declining cohorts (e.g., a team with activation <50% week-over-week).
Quick targets (example)
- Activation Rate: >60% within 7 days for targeted cohorts.
- Time to Proficiency: <30 days for core roles (adjust per workflow).
- License Utilization: Recoverable target—reduce unused seats by 25% in 90 days.
FAQ
Q: What’s the single most important metric to start with?
Start with license utilization plus activation rate. Together they show cost exposure and initial adoption momentum.
Q: How granular should feature telemetry be?
Begin with 6–10 events that map to core tasks. If a feature is critical to workflows, instrument steps that show task completion rather than just clicks.
Q: Can adoption dashboards support finance requests?
Yes. License utilization, reclaimed licenses, and reduced ticket volume are the three signals CFOs want to see. Tie them to a dollar value to make the case.
Sources
Zylo 2024 SaaS Management Index
Measure App Performance – Teams (Microsoft Learn)
Suggested URL slug: /kpi-dashboard-software-adoption-12-metrics